
Case Study: Unified Customer Data Platform Built on Grist
The customer’s business ran across five systems that were until now entirely independent. QuickBooks held the financial picture. HubSpot tracked contacts and deals. WooCommerce captured every order. Mailchimp, social media platforms, and standalone landing pages generated the leads and tracked where they came from. A hand-built Google Sheets spreadsheet held the custom business logic that made sense of it all. None of them talked to any other.
The client wanted to answer questions like:
- Where did this customer come from
- What were they interested in, and
- What did they actually buy?
Answering these questions used to require exporting from five platforms, reconciling by hand, and accepting that the numbers would be stale before the spreadsheet was finished. Or more realistically… just not doing it and flying on gut instinct.
We built a unified data intelligence platform on Grist that connects all seven data sources into one relational model. It tracks every customer’s full journey from first touch through every purchase, and cost our client just $15,000 as a one-time investment instead a comparable commercial solution running roughly $60,000 per year.
This case study covers:
- The seven-source integration architecture and the time-stamped customer journey graph at its center
- The six categories of reports the platform now produces that weren’t possible before
- Why the open Grist foundation matters for what comes next: conversational AI, BI tools, and future integrations
- The full cost comparison: $15,000 one-time versus $60,000 per year, including what data ownership adds
- The conditions under which a commercial CDP is still the better answer
Five disconnected systems, one unanswerable question

The data silo problem at the mid-market level is structural rather than accidental. When accounting, CRM, e-commerce, and marketing operations each run on a purpose-built tool, those tools don’t share a data model. Research on CRM adoption finds that nearly half of CRM users say data quality issues significantly impact how useful their system is.
For this customer, the picture looked like this:
- QuickBooks — financial data: invoices, revenue, the accounting source of truth
- Google Sheets — a hand-built spreadsheet encoding the custom business logic and operational reporting that stitched everything else together
- HubSpot CRM — contacts, companies, and deals; the full relationship and sales history
- WooCommerce — every purchase and order, from product to transaction record
- Mailchimp, social media, and landing pages — the demand side: where visitors came from and what they engaged with before converting
There was no way to run that query in real time, and no mechanism to replay a specific customer’s journey without doing the work again from scratch.
The integration architecture: seven sources, one relational graph, time-stamped customer journeys

The platform connects every system the customer runs into a single Grist relational model. Each source has its own integration path into the shared data layer:
- QuickBooks — financial data (invoices, revenue, accounting records) feeds in so that operational reporting reconciles against the books directly, without a separate export step
- Google Sheets — the customer’s existing spreadsheet logic is preserved and connected rather than discarded; the operational rules encoded in those formulas carry forward into the new model
- HubSpot CRM — contacts, companies, and deals link each person to their full relationship and sales history
- WooCommerce — every purchase and order is captured and tied back to the customer record
- Mailchimp — email campaigns tracked by campaign name and subscriber, so the path from a specific send to a purchase is visible
- Social media channels — organic and paid social sources tracked by channel, matching each visitor’s origin to their customer record
- Landing pages — each landing page URL tracked as a conversion source, linking every first interaction to the customer journey that followed
The keystone of the architecture is time-stamped customer journey tracking. Every conversion source, every CRM interaction, and every WooCommerce purchase resolves back to one person in the relational model. The result is a single connected graph of the customer journey: every event logged in sequence, so any customer’s full timeline from first touch through every purchase can be queried in one place.
A the customer’s request, we maintained a primary link to their internal Google Sheets as their team uses it daily. The company’s working methodologies were connected and preserved rather than needlessly replaced. This not only helped make adoption instantaneous, but it also fits with how mid-market businesses operate. They often have years of operational knowledge encoded in their home-made tools (spreadsheets) — things like specific rules and formulas that took time to build, and reflect how the business actually works. Treating those as a data source that carries forward into the new model meant the customer didn’t lose what they’d already built and can rely on their same procedures they use today (until they decide those also need to or are ready to modernize of course!).
Six report categories that weren’t possible before

Because every system feeds one relational model, the platform produces reports that require manual cross-system reconciliation. Here are the new reports the system delivers daily:
Full customer journey. For any individual, the complete timeline across all connected systems: first touch through every CRM interaction and every purchase, in chronological order with timestamps. The full sequence can be replayed for any customer at any point, without exporting anything.
Interest-versus-purchase analysis. A direct comparison of what each customer engaged with versus what they actually bought. The gap between intent and conversion, surfaced per customer and in aggregate. This is the report that starts to answer why some engaged visitors don’t convert, and which interests tend to precede purchases.
Path-to-purchase reports. For each purchase, the full sequence of touchpoints that preceded it: which Mailchimp campaigns, social posts, or landing pages were part of the customer’s path before they bought. The platform shows which sequences actually drove conversion rather than just which channels generated volume.
Conversion source attribution. Revenue and conversions attributed back to specific Mailchimp campaigns, social media sources, and individual landing pages. The channel that drives paying customers, not just the one that drives clicks, becomes visible.
Financial reconciliation. WooCommerce revenue and HubSpot deal values reconciled directly against QuickBooks, so operational reporting and the financial books agree without a manual export step. The version-control problem of maintaining separate spreadsheet exports disappears.
CRM-linked commerce reporting. HubSpot contacts and deals joined to actual WooCommerce purchase behavior — sales context and buying history in a single view.
Why Grist: the open, queryable foundation
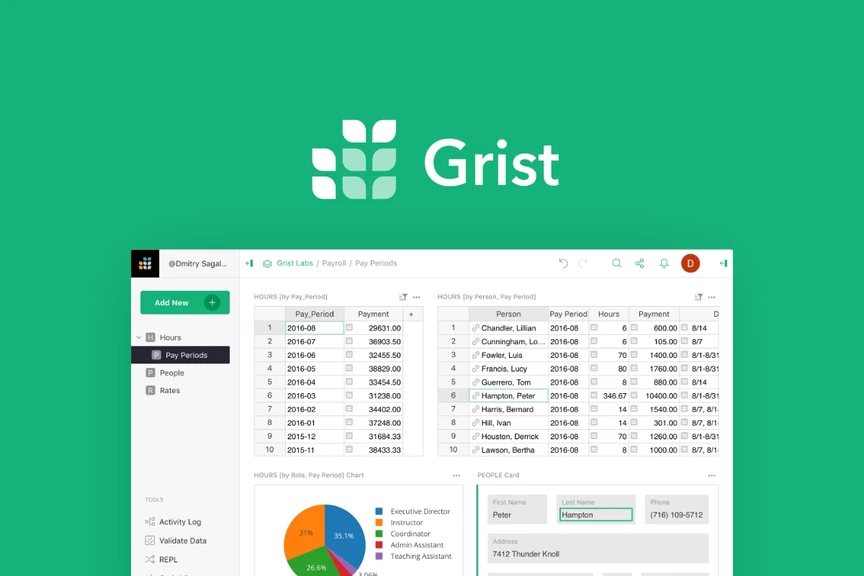
In this case our client really wanted a spreadsheet as the output format. But rather than just generate a standard Google or Microsoft spreadsheet, we ended up electing to build it out on the Grist platform. It’s still cheaper than building a web application, but only slightly more complex than building a spreadsheet, and arguably less costly in the long run because your system is future-forward because it is built upon a real database. From here you can easily add a beautiful web interface, ai chat bots and charting on demand.
Grist is an open-source relational spreadsheet that combines the flexibility of a spreadsheet with the structure of a real database. It supports Python formulas, cross-table references, and direct structured queries, which makes it a capable foundation for a custom data integration layer.
The data lives in a real relational database the customer owns and can query directly, not locked inside a vendor’s dashboard. Any tool that can connect to a structured data source can sit on top of the same Grist foundation without requiring the integration architecture to be rebuilt. Adding a new data source or plugging in a new reporting tool is an incremental change to the existing model, not a separate engineering project.
In practice, this means conversational AI agents can query the customer’s full data model in plain language (“show me everyone who engaged with the spring campaign but never purchased”) without custom analytics engineering each time. A BI tool or dashboard that needs the same underlying data doesn’t require a separate integration. The customer owns the data model, the integration logic, and the query layer. What connects to it in the future is their choice.
The ongoing integration maintenance (keeping the data flows running as source system APIs change over time) is handled through AI workflow automation at a low monthly upkeep cost. When a source API updates, the workflow layer handles the adjustment without manual engineering each time a platform rolls out a change.
The build-versus-buy question for situations like this tends to come down to whether the value of ownership compounds over time. For a business with a stable system stack and clear data requirements, an open foundation tends to appreciate: every new tool connected to it adds value without additional integration overhead. For a business whose systems change frequently or whose team lacks the internal capacity to manage the build, the calculation shifts toward a managed platform. The right answer depends on the specific situation, not a general principle.
The cost comparison: $15,000 one-time versus $60,000 per year

A comparable off-the-shelf data intelligence platform delivering the same unified customer view, attribution reporting, and journey tracking was quoted to our client at a cost of $60,000 per year. That figure sits at the upper end of the SMB price band: customer data platform pricing for small-to-midsize businesses typically runs $1,000 to $10,000 per month, depending on data volume and the number of connected destinations.
The customer ended up paying us $15,000 one-time for Release 1, plus a very low monthly upkeep cost to maintain the integrations. The comparison at each horizon:
| Commercial platform | This build on Grist | |
|---|---|---|
| Year 1 | ~$60,000 | $15,000 + low monthly upkeep |
| Ongoing | ~$60,000 / year | Low monthly upkeep only |
| Data ownership | Vendor-controlled | Customer owns it |
| AI / reporting extensibility | Locked to vendor features | Open — plug in anything |
The cash comparison is clear in year one. The non-cash component compounds over a longer horizon: the customer owns the data model, the integration logic, and the ability to connect future tools without renegotiating a contract or waiting on a vendor roadmap. A commercial platform built for the same purpose draws $60,000 per year while delivering a closed system. The Grist build draws a maintenance cost while delivering an open foundation that accumulates value as additional tools and sources connect to it.
Why so cheap?
Things really have changed in the last two years. Our prices now are roughly 3 to 10 times cheaper for the same application / SaaS or website development project than they used to be back in 2024. This is all made possible because of our advanced and experienced Agentic AI Development practices. This is the kind of project that Fountain City’s agentic applications process handles easily: multi-source data integrations with AI-enabled query layers, scoped, heavily tested and priced as one-time project builds plus ongoing maintenance rather than recurring platform licenses.
When the commercial CDP is still the right call
A custom build on Grist isn’t the right answer for every business. There are conditions where the off-the-shelf CDP is the cleaner choice:
When you have a dedicated data engineering team. The maintenance overhead that makes a custom build economical for a 50-person business with a focused system stack looks different at an organization that is much larger with full-time data engineers. At that scale, the operational complexity of a self-managed integration layer is a real cost, and a commercial platform’s managed connectors and SLAs start to make economic sense regardless of the license fee.
When compliance mandates require a certified vendor. SOC 2 Type II or FedRAMP attestation from a third-party vendor is a genuine requirement in regulated industries. A Grist build can be run in a compliant environment, but the attestation comes from the infrastructure layer rather than the platform itself. If your compliance posture requires direct CDP vendor certification, that changes the calculation in a way the cost comparison doesn’t capture.
When you need enterprise SLAs and multi-region scale. Commercial CDPs offer uptime guarantees, 24/7 support contracts, and multi-region data residency as part of their platform pricing. A custom build inherits the SLAs of its components. If those are genuinely load-bearing requirements for your operations, paying for a managed platform could be a reasonable trade. (But you should still do the math to make sure!)
The honest test: if your compliance posture, engineering headcount, or scale requirements exceed what an owned build can absorb, the commercial CDP earns its price. If they don’t, the $60,000 per year is largely paying for infrastructure overhead and platform extensibility that will probably never get justified.
For a broader treatment of the build-versus-buy question in AI-adjacent systems, this guide on when to build versus buy covers the decision criteria in more depth.

Related case study
For a different kind of multi-system integration, please see The Wiseman Group case study which covers a similar pattern but applied to predictive modeling (machine learning) to help marketing make better informed intelligent decisions.
If you’re working out whether a build like this makes sense for your business, the starting point is usually a conversation about your system stack and the questions you can’t currently answer. Fountain City’s Advisory & Consulting practice is a great place where your conversation can start.
Frequently asked questions
What is a customer data platform (CDP)?
A customer data platform collects and unifies customer data from multiple sources — CRM, e-commerce, email, advertising — into a single persistent profile database so every function in the business works from the same customer record. Commercial CDPs like Segment, mParticle, and Salesforce Data Cloud handle integration connectors, data modeling, and storage on the vendor’s infrastructure. A custom build like this Grist platform achieves the same unified profile outcome on infrastructure the customer owns and controls.
What is Grist and can it be used as a customer data platform?
Grist is an open-source relational spreadsheet that combines the flexibility of a spreadsheet with the structure of a real database. It supports Python formulas, cross-table references, and direct structured queries, which makes it a viable foundation for a custom data integration layer. It doesn’t ship with pre-built connectors to HubSpot, WooCommerce, or QuickBooks the way a commercial CDP does; those integrations are built on top of it. Because the data model is open and queryable, any tool that can read a structured database can connect to it — including conversational AI and BI reporting tools.
How much does it cost to build a custom unified data platform for a mid-market business?
For a seven-source integration covering the stack described in this case study — QuickBooks, Google Sheets, HubSpot, WooCommerce, Mailchimp, social media, and landing pages — the build came to $15,000 one-time for Release 1, plus a very low monthly upkeep cost to maintain the integrations as source system APIs change. A comparable off-the-shelf commercial CDP runs roughly $60,000 per year for an SMB at this scale; the custom build pays for itself against that benchmark well within year one.
What’s the difference between a Grist-based build and an off-the-shelf CDP like Segment or Salesforce Data Cloud?
The main differences are ownership and extensibility. A commercial CDP manages connectors, data modeling, and storage on its own infrastructure — managed reliability and pre-built integrations, but the data lives in the vendor’s system. A Grist-based build puts the data model on your own infrastructure; you own the integration logic, the schema, and the query layer, and new tools connect to it without a vendor conversation or a feature request cycle. The commercial CDP earns its price when managed infrastructure, SLAs, or compliance attestation are load-bearing requirements. The custom build earns its when your requirements fit a known scope and long-term data ownership matters.
How do you integrate QuickBooks, HubSpot, WooCommerce, and Mailchimp into a single source of truth?
Each source system exposes data via its API; the integration layer pulls from each on a defined schedule and writes into the Grist relational model. QuickBooks connects via its accounting API, HubSpot via its CRM API, WooCommerce via its orders API, and Mailchimp via its campaign and subscriber API. The key design decision is how the relational model resolves records from different sources to the same customer. Time-stamped event logging on each record is what enables the customer journey view — every event carries a timestamp and resolves to one person, so any customer’s full sequence can be reconstructed in order.
Who owns the data when you build on Grist instead of a SaaS CDP?
The customer does. The data model, integration logic, and query layer all live on infrastructure the customer controls. There’s no vendor lock-in on the data itself — if the customer changes their tooling approach, the data goes with them. Commercial CDPs typically host customer data on their own infrastructure; migrating off involves extracting your data from their system, with complexity that varies by vendor and contract.
When does it make more sense to buy a CDP than to build one?
When maintenance overhead is genuinely load-bearing — typically when a dedicated data engineering team’s time has a direct cost. When compliance requirements mandate certified third-party vendor attestation (SOC 2, FedRAMP) that a self-managed build can’t provide directly. When enterprise SLAs, 24/7 vendor support, or multi-region data residency are real operational requirements. If those conditions apply, the commercial CDP earns its license cost. If they don’t, the recurring fee is primarily paying for overhead and extensibility that may not get used.
What is customer journey tracking and what does ‘time-stamped’ mean in this context?
Customer journey tracking records every significant interaction a customer has with a business — ad click, email open, landing page visit, CRM note, purchase — and links all those events to the same person across systems. “Time-stamped” means each event carries the date and time it occurred, so the full sequence can be reconstructed in chronological order. The value is seeing not just what a customer did, but when: which touchpoints preceded which purchases, how much time passed between first contact and first purchase, and what the complete arc of the relationship looks like from first touch through the most recent transaction.